Debugging operators can be tricky, especially if the operator needs to be debugged on a live cluster, which is useful for developing Red Hat OpenShift cluster operators. Remotely running delve debugger inside the container helps in this case. This article is about debugging operators live in an OpenShift cluster on the fly by rebuilding the operator container image and using go dlv remotely through the oc port-forward.
About cluster operators and Delve debugger
Kubernetes operators are used to manage the lifecycle of applications within a Kubernetes cluster. The operator pattern is aimed at simplifying installation, management, and configuration of applications and services. OpenShift is an operator-first platform with its fundamental architecture strongly rooted to various operators. In the OpenShift world, operators help to manage the lifecycle of the running cluster as well as different applications that run on top of it. With each OpenShift cluster installation, there comes a set of default operators known as cluster operators which help to manage different aspects of the OpenShift cluster. An OpenShift cluster marks cluster creation as complete once all the cluster operators running in the cluster can reach a healthy running state.
Cluster Version Operator (CVO) is one of the important cluster operators that reconciles the resources within the cluster to match them to their desired state while ensuring that other cluster operators remain healthy. Each cluster operator manages specific area of the cluster’s functionality and these operator deployments observe a few set of args in their respective deployments manifests as per the configuration set by the cluster apart from other necessary values.
For the purpose of this example, we will use the cluster-kube-apiserver-operator running on an OpenShift cluster and live debug the running operator remotely on a VS Code setup using go dlv debugger.
Delve is one of the most widely used debuggers used for Golang. It has the option to allow debugging a go binary remotely through a connected tcp port with the help of which developers can get debug access to the operator binary running inside the actual cluster.
Debugging tutorial steps
The following tutorial is aimed at allowing developers to debug operators running on the cluster.
The first step to modifying any cluster operator running on OpenShift is to disable the CVO this would help prevent the cluster operator deployment manifests to be tweaked without having it be reconciled to to the default image. With the kubeconfig of the running cluster and via oc command, the following command would disable CVO completely.
$ oc scale --replicas=0 deploy/cluster-version-operator -n openshift-cluster-version
Alternatively, if the cluster operator itself allows the user to set it to an unmanaged state through the ClusterVersion object, for the kube-api-server operator it would be as follows:
$ oc patch clusterversion/version --type='merge' -p "$(cat <<- EOF
spec:
  overrides:
  - group: apps
    kind: Deployment
    name: kube-apiserver-operator
    namespace: openshift-kube-apiserver-operator
    unmanaged: true
EOF
)"
Either methods should work except that the first method completely disables CVO while the second method is specific to allowing deployment changes to kube-api-server operator only. It is noteworthy to mention that these steps are not required if you plan to use this tutorial to debug operators which are not OpenShift cluster operators. In that case, you can start past this point.
The deployment for kube-api-server operator can be displayed as follows:
$ oc get deployment/kube-apiserver-operator -o yaml -n openshift-kube-apiserver-operator
---
  name: kube-apiserver-operator
  namespace: openshift-kube-apiserver-operator
  ownerReferences:
  - apiVersion: config.openshift.io/v1
    kind: ClusterVersion
    name: version
    uid: 4b0f3c33-ade3-4e67-832f-169f8e297639
---
spec:
---
    spec:
      automountServiceAccountToken: false
      containers:
      - args:
        - --config=/var/run/configmaps/config/config.yaml
        command:
        - cluster-kube-apiserver-operator
        - operator
        env:
        - name: IMAGE
          value: quay.io/openshift-release-dev/ocp-v4.0-art-dev@sha256:0314d2c0df2cf572cf8cfd13212c04dff8ef684f1cdbb93e22027c86852f1954
        - name: OPERATOR_IMAGE
          value: quay.io/openshift-release-dev/ocp-v4.0-art-dev@sha256:2766c4f3330423b642ad82eaa5df66a5a46893594a685fd0562a6460a2719187
        - name: OPERAND_IMAGE_VERSION
          value: 1.25.2
---
As one can observe for the proper functioning of this operator, there are various container args plus environment variables required to be set as a part of the container spec. While debugging operators, developers usually start off by running the Golang binaries locally but it can get cumbersome to set these args and environment variables manually. To avoid this, we can rebuild the operator’s image with a debugger-friendly binary, push it to a registry, and use it in the deployment manifest of the operator.
In the case of kube-apiserver-operator, one can obtain the source of the operator by cloning it from the GitHub repository, and this step should be similar for any other operator or the developer should have the source files ready on their local at the time of reading this.
Launch a VS Code editor from the local folder containing the source files. Make the following changes to the Dockerfile of the operator.
We create a copy of the Dockerfile and ensure that Go build of the binaries are built with the gcflags as “all=-N -l” before. It can either be passed at command line using go build -gcflags="all=-N -l" or by setting environment variable GCFLAGS. This should be set as a builder stage of the Dockerfile where binaries are compiled from source. For kube-apiserver-operator, the environment variable was set.
FROM ... AS builder
RUN go install -mod=readonly github.com/go-delve/delve/cmd/dlv@latest
...
COPY . .
ENV GO_PACKAGE github.com/openshift/cluster-kube-apiserver-operator
ENV GCFLAGS "all=-N -l"
RUN make build --warn-undefined-variables
...
The same dlv binary needs to be copied over to the final image as well, using the following command:
FROM ...
COPY --from=builder /go/bin/dlv /usr/bin/
...
This would ensure that at the time of running the binary in the container as a part of the operator deployment, we can run it using dlv and bind the debug stub inside the container to a port that can later be port-forwarded.
The final Dockerfile would be as follows:
FROM ... AS builder
RUN go install -mod=readonly github.com/go-delve/delve/cmd/dlv@latest
WORKDIR /go/src/github.com/openshift/cluster-kube-apiserver-operator
COPY . .
ENV GO_PACKAGE github.com/openshift/cluster-kube-apiserver-operator
ENV GCFLAGS "all=-N -l"
RUN make build --warn-undefined-variables

FROM ...
COPY --from=builder /go/bin/dlv /usr/bin/
...
The same can be done for any other operator including ones which are not cluster operators. The only necessity is to build the Go binary with -l and -N to ensure that the linker keeps the symbols for helping to debug later. The size of the debug binary and hence the debug image could be more than the stripped binary we ship in production operators.
After obtaining the newly modified Dockerfile at Dockerfile.debug, we can build and push it to the registry using:
$ podman build -t quay.io/<USERNAME>/<REPO>:<ANY_TAG> -f Dockerfile.debug .
[1/2] STEP 1/7: ...
---
[2/2] COMMIT quay.io/swghosh/cluster-kube-apiserver-operator:debug
--> b18f722bd49
Successfully tagged quay.io/swghosh/cluster-kube-apiserver-operator:debug
b18f722bd49ad82b8763917800eb0481ef0135b6b1f619973a6fb7c144a09cef

$ podman push quay.io/<USERNAME>/<REPO>:<ANY_TAG>
---
Copying blob 7c33fa50bff3 done
Copying config b18f722bd4 done
Writing manifest to image destination
Storing signatures
The next step would be to patch the deployment of the running operator to use the this newly prepared image and alter the container args of the same to run using dlv.
$ oc edit deployment kube-apiserver-operator -n openshift-kube-apiserver-operator
# Change the spec.template.containers[0].args,command to use dlv
     - args:
        - --listen=:40000
        - --headless=true
        - --api-version=2
        - --accept-multiclient
        - exec
        - /usr/bin/cluster-kube-apiserver-operator
        - --
        - operator
        - --config=/var/run/configmaps/config/config.yaml
        command:
        - /usr/bin/dlv
# Change the spec.template.containers[0].image
        image: quay.io/swghosh/cluster-kube-apiserver-operator:debug
The dlv binary needs to be run in the container which would execute the built Golang binary of the operator. For any operator, the patch would finally to run the command: /usr/bin/dlv --listen=:40000 --headless=true --api-version=2 --accept-multiclient exec /usr/bin/<operator_binary> -- <other_operator_args>. Headless and listen arguments for dlv are required to enable the dlv debugger to run as a stub in headless mode and bind it to a container port which we can access later. Once edited, we can save the deployment and close the editor for the new operator pod to take effect.
Verify that the new operator pod is running after the manifest change as follows:
$ oc get pods -n openshift-kube-apiserver-operator
NAME                                       READY   STATUS    RESTARTS   AGE
kube-apiserver-operator-86c5fc45cd-rr695   1/1     Running   0          29s
Once the pod is in running state, port-forward 40000 port from the container which is the dlv debug port (used before as a part of --listen). This would enable the traffic at localhost:40000 to be forwarded to 40000 port bound to dlv process inside the container. Re-run the command if the connection for the port-forward times out.
$ oc port-forward pod/kube-apiserver-operator-65bd9656cc-jdvjr 40000 -n openshift-kube-apiserver-operator
Forwarding from 127.0.0.1:40000 -> 40000
Forwarding from [::1]:40000 -> 40000
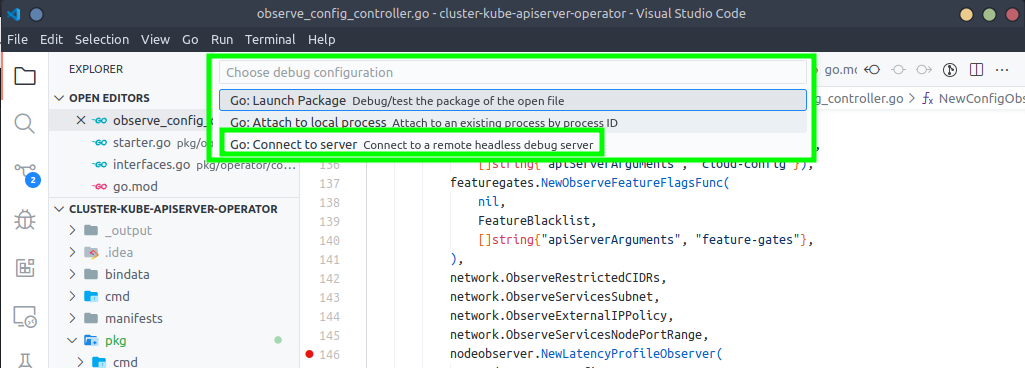
Now, this operator can be debugged from VS Code or using dlv from the command line and connecting to localhost:40000. To debug it using VS Code, select the remote attach debugger option in Run > Add Configuration > Go: Connect to Server (as shown in Figure 1). This action will allow remote Go debugging.
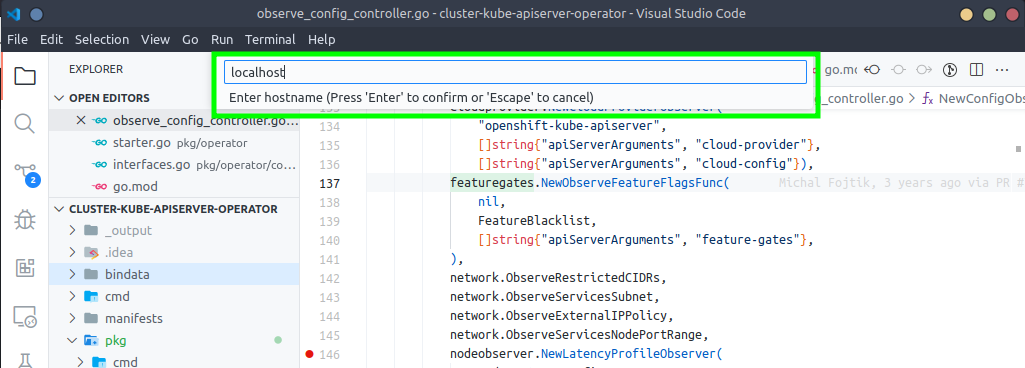
Next, connect to the localhost (as shown in Figure 2).
Then, set the port to 40000 (as shown in Figure 3).

Finally, the launch.json in the .vscode directory of the local source directory would contain something similar to what is shown in Figure 4. The contents of launch.json will be auto-generated with the necessary configurations provided by the remote host and port set in the previous steps.

After the launch.json is setup with the necessary details, you can start the Debug > Connect to server target (as shown in Figure 5). Start live debugging of the Go binary running through delve inside the cluster.

Now you can use breakpoints, watch, check the current call stack, and do much more with your operator all while it is running live in the cluster.
Running remote delve simplifies debugging operators
We have illustrated how to simplify debugging operators by live debugging using dlv remotely. You can say goodbye to eerie print statements. If you have questions, please comment below. We welcome your feedback.
Last updated: September 19, 2023